Back to Article
Script A: literature review
Download Source

Script A: literature review and power analysis

Libraries

In [1]:
library(osfr)
library(tidyverse)
── Attaching core tidyverse packages ──────────────────────── tidyverse 2.0.0 ──
✔ dplyr     1.1.4     ✔ readr     2.1.4
✔ forcats   1.0.0     ✔ stringr   1.5.1
✔ ggplot2   3.5.1     ✔ tibble    3.2.1
✔ lubridate 1.9.3     ✔ tidyr     1.3.1
✔ purrr     1.0.2     
── Conflicts ────────────────────────────────────────── tidyverse_conflicts() ──
✖ dplyr::filter() masks stats::filter()
✖ dplyr::lag()    masks stats::lag()
ℹ Use the conflicted package (<http://conflicted.r-lib.org/>) to force all conflicts to become errors
library(knitr)
library(gt)
library(gtExtras)
library(rstatix)

Attaching package: 'rstatix'

The following object is masked from 'package:stats':

    filter
library(ggpubr)

Literature review: summary of results

In [2]:

lit_effects_tbl_filename <- "../supplemental-data/MaskedPrimingDatabase-IDPriming-InteractionFrequency.csv"

lit_effects <- read_csv(lit_effects_tbl_filename)
Rows: 20 Columns: 8
── Column specification ────────────────────────────────────────────────────────
Delimiter: ","
chr (4): PAPER, LANGUAGE, PRIME_DURATION, p<.05?
dbl (4): N, MOP_HF, MOP_LF, MOP_Interaction

ℹ Use `spec()` to retrieve the full column specification for this data.
ℹ Specify the column types or set `show_col_types = FALSE` to quiet this message.

power_estimates_15 <- read_csv("../supplemental-data/power_estimate2.dataset.range.csv") %>%
  select(nsubj, minPower, maxPower) %>%
  mutate(across(minPower:maxPower, ~round(., 2))) %>%
  mutate(minPower = paste0("[", minPower), maxPower = paste0(maxPower, "]")) %>%
  unite("Power range", minPower:maxPower, sep = " ")
Rows: 19 Columns: 11
── Column specification ────────────────────────────────────────────────────────
Delimiter: ","
chr (3): file_name, PAPER, EXP.
dbl (8): nsubj, minPower, maxPower, rho_min, std_dev_min, rho_max, std_dev_m...

ℹ Use `spec()` to retrieve the full column specification for this data.
ℹ Specify the column types or set `show_col_types = FALSE` to quiet this message.

power_estimates_30 <- read_csv("../supplemental-data/power_estimate3.dataset.range.csv") %>%
  select(nsubj, minPower, maxPower) %>%
  mutate(across(minPower:maxPower, ~round(., 2))) %>%
  mutate(minPower = paste0("[", minPower), maxPower = paste0(maxPower, "]")) %>%
  unite("Power range", minPower:maxPower, sep = " ")
Rows: 19 Columns: 11
── Column specification ────────────────────────────────────────────────────────
Delimiter: ","
chr (3): file_name, PAPER, EXP.
dbl (8): nsubj, minPower, maxPower, rho_min, std_dev_min, rho_max, std_dev_m...

ℹ Use `spec()` to retrieve the full column specification for this data.
ℹ Specify the column types or set `show_col_types = FALSE` to quiet this message.
In [3]:

lit_effects %>%
  left_join(., power_estimates_15, by=join_by("N" == "nsubj"), multiple="first") %>%
  left_join(., power_estimates_30, by=join_by("N" == "nsubj"), multiple="first", suffix = c("_15", "_30")) %>%
  mutate(across(MOP_HF:MOP_Interaction, as.numeric)) %>%
  #group_by(N) %>%
  gt(rowname_col = "PAPER") %>%
  #tab_options(row.striping.include_table_body = FALSE) %>% 
  tab_stubhead(label = "Study") %>%
  tab_spanner(
    label = "MOP (ms)", columns = c(MOP_HF, MOP_LF)
  ) %>% 
  tab_spanner(
    label = "FAE (ms)", columns = c(MOP_Interaction, `p<.05?`)
  ) %>%
  tab_spanner(
    label = "Power range [min max]", columns = c(`Power range_15`, `Power range_30`)
  ) %>%
  cols_label( LANGUAGE = "Language", 
              PRIME_DURATION = "SOA",
              MOP_HF = "HF", 
              MOP_LF = "LF", 
              MOP_Interaction = "ES",
              `p<.05?` = md("_p_<.05?"),
              `Power range_15` = "FAE=15ms",
              `Power range_30` = "FAE=30ms"
  ) %>%
  tab_footnote( 
    footnote = "SOA for each subject determined by pre-test", 
    locations = cells_body(column = "PRIME_DURATION", rows = 14)
  ) %>%
  tab_footnote(
    footnote = "Reported in Masson & Bodner (2003)",
    locations = cells_stub(rows = 16) 
  ) %>% 
  grand_summary_rows(
    columns = c(MOP_HF, MOP_LF, MOP_Interaction),
    fns = list(Mean ~ round(mean(.)),
               SD ~ round(sd(.))), 
    missing_text = " " 
  ) %>%
  grand_summary_rows(
    columns = c(MOP_Interaction),
    fns = list(Correlation ~ round(cor(MOP_HF, MOP_LF), 2)), 
    missing_text = " " 
  ) %>%
   sub_missing(
    missing_text = " "
  )

litReview.stats <- lit_effects %>%
    select(PAPER, MOP_HF, MOP_LF) %>%
    pivot_longer(MOP_HF:MOP_LF, names_to = "frequency.condition", values_to="mean.priming") %>%
    mutate(frequency.condition = factor(frequency.condition, levels=c("MOP_LF", "MOP_HF"))) %>%
    t_test(mean.priming ~ frequency.condition, paired=T, detailed=T)
Summary of the masked repetition priming effects as a function of word frequency reported in the literature. The power range estimates were calculated by simulating 10,000 datasets with the corresponding sample size (N) and FAE = 15 ms and 30 ms.
Study Language N SOA MOP (ms) FAE (ms) Power range [min max]
HF LF ES p<.05? FAE=15ms FAE=30ms
Forster, Davis, Schoknecht, & Carter (1987), exp. 1 English 16 60 61 66 5
[0.02 0.24] [0.04 0.84]
Norris, Kinoshita, Hall, & Henson (2018) English 16 50 38 51 13
[0.02 0.24] [0.04 0.84]
Sereno (1991), exp. 1 English 20 60 40 64 24
[0.02 0.33] [0.04 0.92]
Forster & Davis (1991), exp. 5 English 24 60 54 72 18
[0.02 0.4] [0.05 0.96]
Bodner & Masson (1997), exp. 1 English 24 60 29 45 16
[0.02 0.4] [0.05 0.96]
Bodner & Masson (1997), exp. 3 English 24 60 36 50 14
[0.02 0.4] [0.05 0.96]
Forster, Mohan, & Hector (2003), exp. 1 English 24 60 63 60 -3
[0.02 0.4] [0.05 0.96]
Kinoshita (2006), exp. 1 English 24 53 32 38 6
[0.02 0.4] [0.05 0.96]
Kinoshita (2006), exp. 2 English 24 53 29 59 30 * [0.02 0.4] [0.05 0.96]
Norris & Kinoshita (2008), exp. 1 English 24 53 35 66 31 * [0.02 0.4] [0.05 0.96]
Forster, Davis, Schoknecht, & Carter (1987), exp. 4 English 27 60 34 25 -9
[0.03 0.46] [0.05 0.98]
Forster & Davis (1984), exp. 1 English 28 60 45 38 -7
[0.03 0.48] [0.06 0.98]
Nievas (2010), exp. 1b Spanish 30 50 44 65 21 * [0.03 0.52] [0.06 0.99]
Nievas (2010), exp. 2a Spanish 30 50 or 331 51 58 7
[0.03 0.52] [0.06 0.99]
Segui & Grainger (1990), exp. 4 French 36 60 42 45 3
[0.03 0.63] [0.07 1]
Bodner & Masson (2001), exps. 2A, 2B, 3, & 6 (average)2 English 40 60 37 69 32 * [0.03 0.68] [0.08 1]
Rajaram & Neely (1992), exp. 1 English 48 50 30 37 7
[0.04 0.76] [0.09 1]
Rajaram & Neely (1992), exp. 2 English 48 50 45 78 33
[0.04 0.76] [0.09 1]
Wu (2012), exp. 5 English 64 60 31 64 33 * [0.04 0.87] [0.12 1]
Wu (2012), exp. 5 English 64 40 33 51 18 * [0.04 0.87] [0.12 1]
Mean


40 55 15


SD


10 14 13


Correlation


0.41


1 SOA for each subject determined by pre-test
2 Reported in Masson & Bodner (2003)

Power analysis

In [4]:

load("../supplemental-data/freq_atten_sim.10ms.RData")

freq_atten_exp2.10ms_df.sub <- freq_atten_exp2.10ms_df %>% 
  filter(ES == 10) %>%
  filter(std_dev >= 80 & std_dev <= 120) %>%
  filter(rho >= 0.7 & rho <= 0.9)

freq_atten_exp2.10ms_df.sub |>
  ggplot(aes(y = power_unadjusted, x = nsubj)) + 
    geom_line() + 
    geom_point() +
    geom_hline(yintercept = 0.8, color = "red2") + 
    facet_grid(rho ~ std_dev) +
  scale_x_continuous(sec.axis = sec_axis(~ . , name = "sd", breaks = NULL, labels = NULL)) +
  scale_y_continuous(sec.axis = sec_axis(~ . , name = "cor", breaks = NULL, labels = NULL)) +
  theme_bw()+
    theme(#axis.line = element_line(colour = "black"),
      panel.grid.major = element_blank(),
      panel.grid.minor = element_blank(), 
      panel.border = element_blank(),
      legend.position="none"
      #panel.background = element_blank() 
     )+
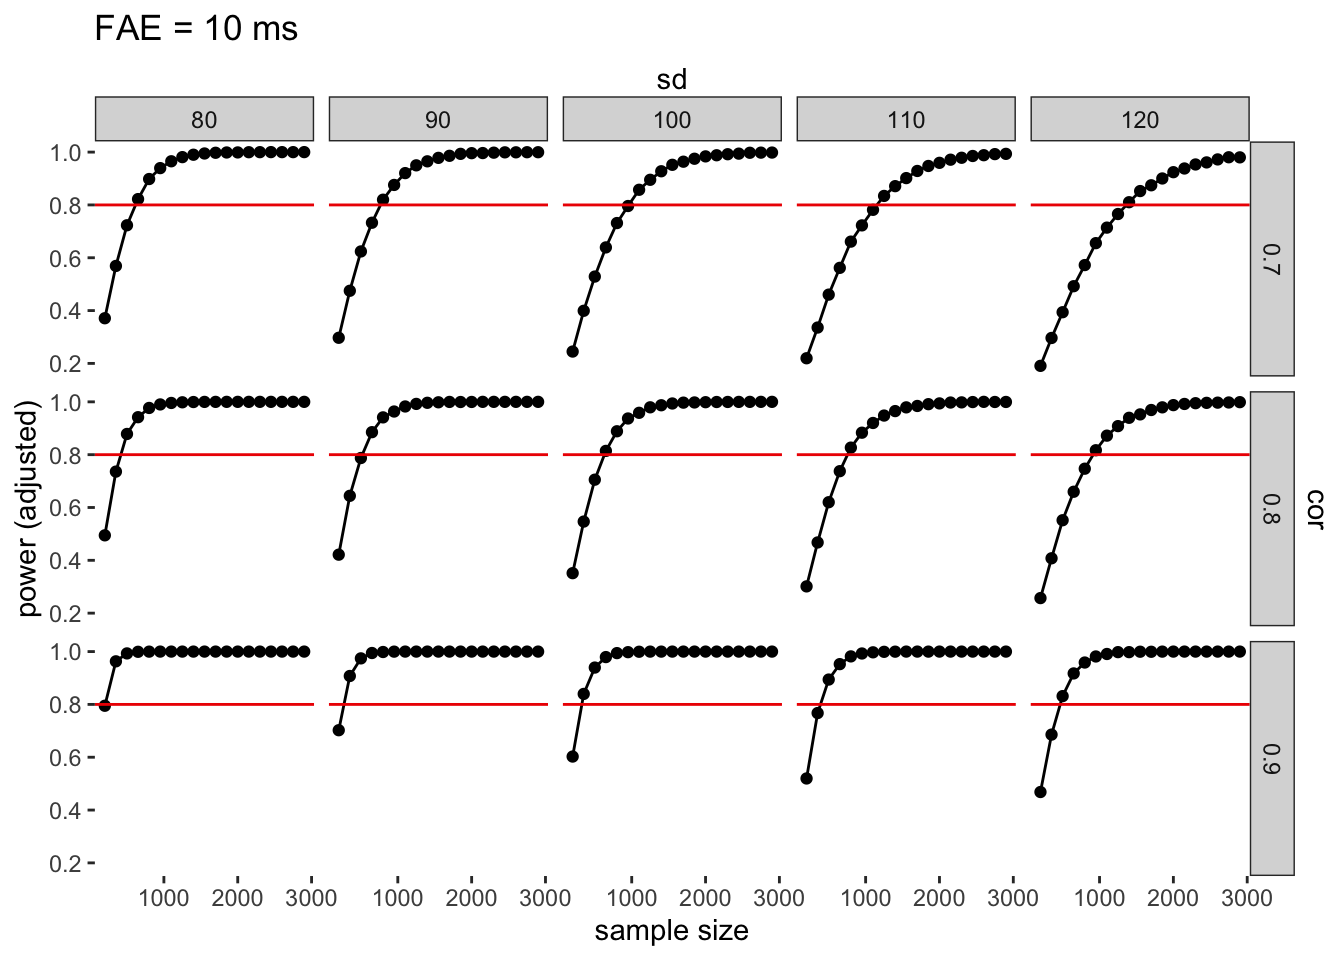
  labs(title="FAE = 10 ms", y = "power (adjusted)", x = "sample size")
Power simulations for a FAE = 10 ms, for all combinations of standard deviation (sd), correlation (cor), and sample size. The red line identifies the threshold of 80% power.